Hello.
In this lesson, I’ll introduce you to the graph of the modulus or the absolute value function. That is, the graph of
y = |x|
To plot the graph, we’ll go back to the definition of |x|
\( |x| = \left\{\begin{matrix}
x,&when\ x\ge0\\
-x,& when\ x<0
\end{matrix}\right.\)
That means, to plot the graph of y = |x|, we have to plot the graph of
y = x, when x ≥ 0
y = –x, when x < 0
Both these graphs are fairly easy to plot (assuming you’re familiar with plotting straight lines).
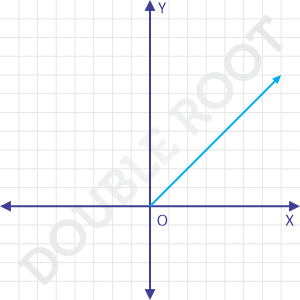
This is how the graph of y = x looks like (i.e. a straight line with a slope of 1 and y-intercept as 0).
But we need this only for x ≥ 0. So, we’ll get something like this.
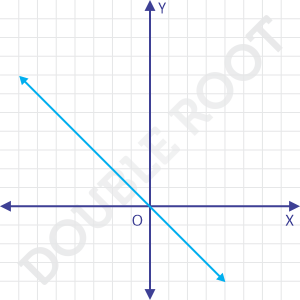
And, this is how the graph of y = –x looks like (i.e. a straight line with a slope of -1 and y-intercept as 0).
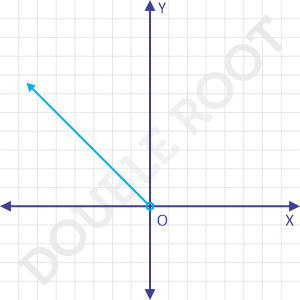
But we need to plot this only for x < 0. And, we’ll get something like this.
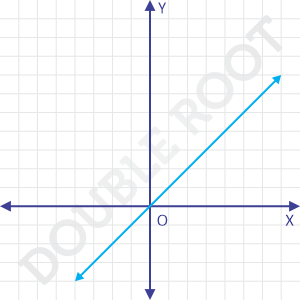
Combining the two, we’ll get the graph of y = |x| as this.
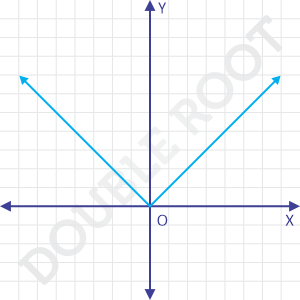
Here’s an interactive version of the same.
Play around with the values of x and observe the values of y (or |x|). Do they follow the definition?
Notice that the entire graph lies above the x-axis (except when x = 0, where the graph intersects the x-axis).
This means that the values of y (or |x|) are always greater than 0 (except when x = 0, where y also equals 0).
In other words, |x| ≥ 0 for any value of x.
That’s all for this lesson. In the next one, we’ll look at the graphs of functions like |x + 1|, |x – 4|, etc. See you there!