In this lesson, we’ll learn how to plot the graphs of functions like |x – 4|, |x + 1|, |2x – 1|, etc.
To plot these, we’ll use the definition again, just like we did for |x|. Let’s start with the first one.
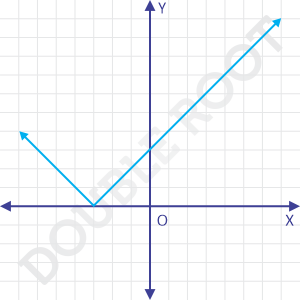
\( |x – 4| = \left\{\begin{matrix}
x,&when\ x \ge4\\
-x,& when\ x<4
\end{matrix}\right.\)
That means, to plot the graph of y = |x – 4|, we have to plot the graph of
y = x – 4, when x ≥ 4
y = 4 – x, when x < 4
That is, for x ≥ 4, we’ll draw a line whose slope is 1 and y-intercept is –4. For x < 4, we’ll draw a line whose slope is –1 and y-intercept is 4.
And this is how the graph would look like.
This seems quite similar to the graph of |x|, but ‘shifted’ to the right.
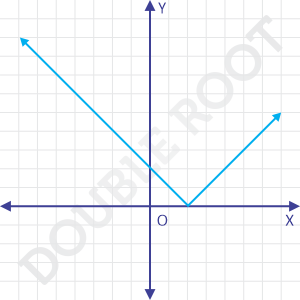
Let’s try the second one. Back to the definition.
\( |x + 1| = \left\{\begin{matrix}
x+1,&when\ x \ge-1\\
-x-1,& when\ x<-1
\end{matrix}\right.\)
That means, to plot the graph of y = |x + 1|, we have to plot the graph of
y = x + 1, when x ≥ –1
y = –x – 1, when x < –1
And this is how the graph would look like.
Once again, similar to the graph of |x|, but shifted to the left.
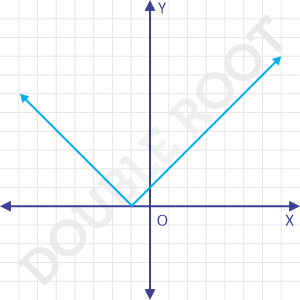
Do you see a pattern? Can you directly plot the graph of |x – 2| and |x + 3|?
Here they are.
|x – 2|
|x + 3|
In case you’re unable to see why the graphs should look like this, try following the definition like the first two cases.
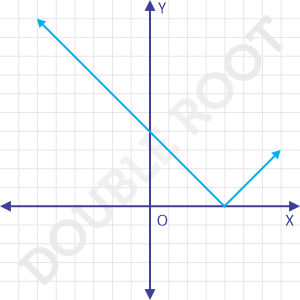
Let’s take the last example, |2x – 1|.
\( |2x – 1| = \left\{\begin{matrix}
2x-1,&when\ x \ge1/2\\
-2x+1,& when\ x<1/2
\end{matrix}\right.\)
That means, to plot the graph of y = |2x – 1|, we have to plot the graph of
y = 2x – 1, when x ≥ 1/2
y = –2x + 1, when x < 1/2
And this is how the graph would look like.

And here’s an applet that shows the graph of y = |ax + b|.
Drag the sliders to change the values of a and b, and see how the graph changes. Things to notice
- the graph always has a ‘V’ shape
- the graph always lies above the X-axis (except for one point)
- the steepness of the ‘V’ is controlled by a
- the location of the vertex is controlled by b (and a)
That’s all for this lesson. In the next few, we’ll use these graphs to solve equations and inequations. It’ll be fun!